


.jpg "7 free tools every network needs")
In the real estate world, the mantra is location, location, location. In the network and server administration world, the mantra is visibility, visibility, visibility. If you don`t know what your network and servers are doing at every second of the day, you`re flying blind. Sooner or later, you`re going to meet with disaster.
Fortunately, many good tools, both commercial and open source, are available to shine much-needed light into your environment. Because good and free always beat good and costly, I`ve compiled a list of my favorite open source tools that prove their worth day in and day out in networks of any size. From network and server monitoring to trending, graphing, and even switch and router configuration backups, these utilities will see you through.
First, there was MRTG. Back in the heady 1990s, Tobi Oetiker saw fit to write a simple graphing tool built on a round-robin database scheme that was perfectly suited to displaying router throughput. MRTG begat RRDTool, which is the self-contained round-robin database and graphing solution in use in a staggering number of open source tools today. Cacti is the current standard-bearer of open source network graphing, and it takes the original goals of MRTG to whole new levels.
Cacti is a LAMP application that provides a complete graphing framework for data of nearly every sort. In some of my more advanced installations of Cacti, I collect data on everything from fluid return temperatures in data center cooling units to free space on filer volumes to FLEXlm license utilization. If a device or service returns numeric data, it can probably be integrated into Cacti. There are templates to monitor a wide variety of devices, from Linux and Windows servers to Cisco routers and switches -- basically anything that speaks SNMP. There are also collections of contributed templates for an even greater array of hardware and software.
While Cacti`s default collection method is SNMP, local Perl or PHP scripts can be used as well. The framework deftly separates data collection and graphing into discrete instances, so it`s easy to rework and reorganize existing data into different displays. In addition, you can easily select specific timeframes and sections of graphs simply by clicking and dragging. In some of my installations, I have data going back several years, which proves invaluable when determining if current behavior of a network device or server is truly anomalous or, in fact, occurs regularly.
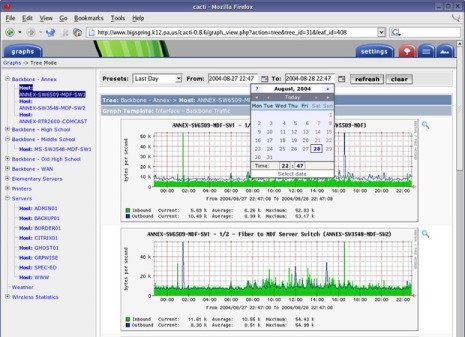
From disk utilization to fan speeds in a power supply, if it can be monitored, Cacti can track it -- and make that data quickly available.
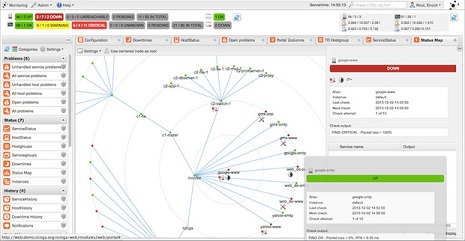
Using the PHP Network Weathermap plug-in for Cacti, you can easily create live network maps showing link utilization between network devices, complete with graphs that appear when you hover over a depiction of a network link. In many places where I`ve implemented Cacti, these maps wind up running 24/7 on 42-inch LCD monitors mounted high on the wall, providing the IT staff with at-a-glance updates on network utilization and link status.
Cacti is an extensive performance graphing and trending tool that can be used to track nearly any monitored metric that can be plotted on a graph. It`s also infinitely customizable, which means it can get complex in places.
Nagios
Nagios is a mature network monitoring framework that`s been in active development for many years. Written in C, it`s almost everything that system and network administrators could ask for in a monitoring package. The Web GUI is fast and intuitive, and the back end is extremely robust.
As with Cacti, a very active community supports Nagios, and plug-ins exist for a massive array of hardware and software. From basic ping tests to integration with plug-ins like WebInject, you can constantly monitor the status of servers, services, network links, and basically anything that speaks IP. I use Nagios to monitor server disk space, RAM and CPU utilization, FLEXlm license utilization, server exhaust temperatures, and WAN and Internet link latency. It can be used to ensure that Web servers are not only answering HTTP queries, but that they`re returning the expected pages and haven`t been hijacked, for example.
Network and server monitoring is obviously incomplete without notifications. Nagios has a full email/SMS notification engine and an escalation layout that can be used to make intelligent decisions on who and when to notify, which can save plenty of sleep if used correctly. In addition, I’ve integrated Nagios notifications with Jabber, so the instant an exception is thrown, I get an IM from Nagios detailing the problem in addition to an SMS or email, depending on the escalation settings for that object. The Web GUI can be used to quickly suspend notifications or acknowledge problems when they occur, and it can even record notes entered by admins.

Nagios can be a challenge for newcomers, but the rather complex configuration is also its strength, as it can be adapted to almost any monitoring task.
As if this wasn`t enough, a mapping function displays all the monitored devices in a logical representation of their placement on the network, with color-coding to show problems as they occur.
The downside to Nagios is the configuration. The config is best done via command line and can present a significant learning curve for newbies, though folks who are comfortable with standard Linux/Unix config files will feel right at home. As with many tools, the capabilities of Nagios are immense, but the effort to take advantage of some of those capabilities is equally significant.
Don`t let the complexity discourage you -- Nagios has saved my bacon more times than I can possibly recall. The benefits of the early-warning systems provided by this tool for so many different aspects of the network cannot be overstated. It`s easily worth your time and effort.
Icinga
Icinga started out as a fork of Nagios, but has recently been rewritten as Icinga 2. Both versions are under active development and available today, and Icinga 1.x is backward-compatible with Nagios plug-ins and configurations. Icinga 2 has been developed to be smaller and sleeker, and it offers distributed monitoring and multithreading frameworks that aren’t present in Nagios or Icinga 1. You can migrate from Nagios to Icinga 1 and from Icinga 1 to Icinga 2.
Like Nagios, Icinga can be used to monitor anything that speaks IP, as deep as you can go with SNMP and custom plug-ins and add-ons.
Icinga offers a thorough monitoring and alerting framework that’s designed to be as open and extensible as Nagios is, but with several different Web UI options.
There are several Web UIs for Icinga, and one major differentiator from Nagios is the configuration, which can be done via the Web UI rather than through configuration files. For those who`d rather manage their configurations outside of the command line, this is a significant benefit.
Icinga integrates with a variety of graphing and monitoring packages such as PNP4Nagios, inGraph, and Graphite, providing solid performance visualizations. Icinga also has extended reporting capabilities.
NeDi
If you`ve ever had to search for a device on your network by telnetting into switches and doing MAC address lookups, or you simply wish you could tell where a certain device is physically located (or, perhaps more important, where it was located), then you should take a good look at NeDi.
NeDi is a LAMP application that regularly walks the MAC address and ARP tables on your network switches, cataloging every device it discovers in a local database. It’s not as well-known as some other projects, but it can be a very handy tool in corporate networks where devices are moving around constantly.
You can log into the NeDi Web GUI and conduct searches to determine the switch, switch port, or wireless AP of any device by MAC address, IP address, or DNS name. NeDi collects as much information as possible from every network device it encounters, pulling serial numbers, firmware and software versions, current temps, module configurations, and so forth. You can even use NeDi to flag MAC addresses of devices that are missing or stolen. If they appear on the network again, NeDi will let you know.
still devoloping


-1780923278.jpg&h=190&w=280&zc=1&q=100)