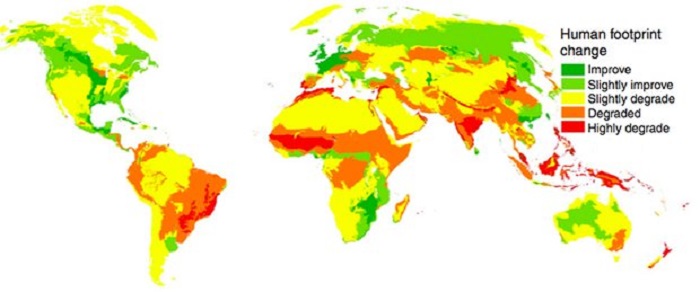
Using data from satellites and on-ground surveys, scientists have created maps that show how the impacts of human activities on the environment (or human footprint) have changed over a 16-year period, between 1993 and 2009.
The team found that while human population increased by 23% and the world economy grew by 153% during this period, human footprint increased by only 9%.
“Seeing that our impacts have expanded at a rate that is slower than the rate of economic and population growth is encouraging,” lead author Oscar Venter of the University of Northern British Columbia, said in a statement. “It means we are becoming more efficient in how we use natural resources.”
To map the impact of human activities across the earth’s land surface, the team analyzed eight variables, such as built-up area, crop land, pasture land, human population density, railways and roads, for the years 1993 to 2009.
These maps, which the scientists say are the first set of temporally inter-comparable human footprint maps, show that human footprint may be reducing. But nearly three-fourths of the earth’s land surface still faces intense, rapidly increasing human pressures.
Regions that are rich in biodiversity, and have a high proportion of threatened species, are under high human pressure, the study found. In fact, only three percent of these hotspots are still free of major human pressures.
Some biomes facing high human footprint include the temperate broadleaf forests of Western Europe, eastern United States and China, the tropical dry forests of India and parts of Brazil, and tropical moist forests of south-east Asia.
“Our maps show that three quarters of the planet is now significantly altered and 97% of the most species-rich places on Earth have been seriously altered,” co-author James Watson from the University of Queensland and Wildlife Conservation Society, said in the statement. “There is little wonder there is a biodiversity crisis.”
Areas with no or low human footprint are also fast disappearing. In 1993, around 27% of the world’s land area had no measurable human footprint, the study found. But by 2009, human activities had encroached upon 9.3% (or 23m sq km) of these areas of previously intact habitats.

Regions with no or low human footprint now occur in deserts like the Sahara, Gobi and Australian deserts, and the most remote moist tropical forests of the Congo basins. Much of the Amazon, too, has low human pressure, the study found, despite being encroached by settlements, agriculture, and waterways and roads.
Wealthy nations in general showed some signs of decreased human footprint. But the researchers caution that it is important to find out the factors that drive this trend. Wealthier countries could simply be shifting their demand for food and raw materials to other countries. For example, nearly 40% of beef produced in the Amazon is exported for consumption in European Union countries, instead of being consumed domestically, researchers say.
The new maps are available to the public at https://azvision.az/redirect.php?url=http://wcshumanfootprint.org/. The team hopes that policy makers and researchers will use these maps for various applications, including identification of places that are still “wild”, have low human footprint and should be protected.
More about:


